
Manufacturing operations depend on a continuous flow of information. Production managers need to know whether machines are running efficiently, production targets are being achieved, downtime is increasing, or quality issues are emerging. When this information is scattered across spreadsheets, machine interfaces, enterprise systems, and manual reports, it becomes difficult to understand what is happening on the production floor at the right time. A Real-Time Monitoring Dashboard brings operational data together into a centralized interface, allowing manufacturers to observe critical processes, identify deviations, and respond to issues more quickly.
Modern manufacturing environments generate enormous amounts of data through machines, sensors, industrial equipment, ERP platforms, MES solutions, and IoT devices. The challenge is no longer simply collecting this information. The real challenge is turning continuously generated data into meaningful operational visibility. A well-designed dashboard can help production teams move from reactive decision-making toward more proactive and data-driven operations.
What is a Real-Time Monitoring Dashboard?
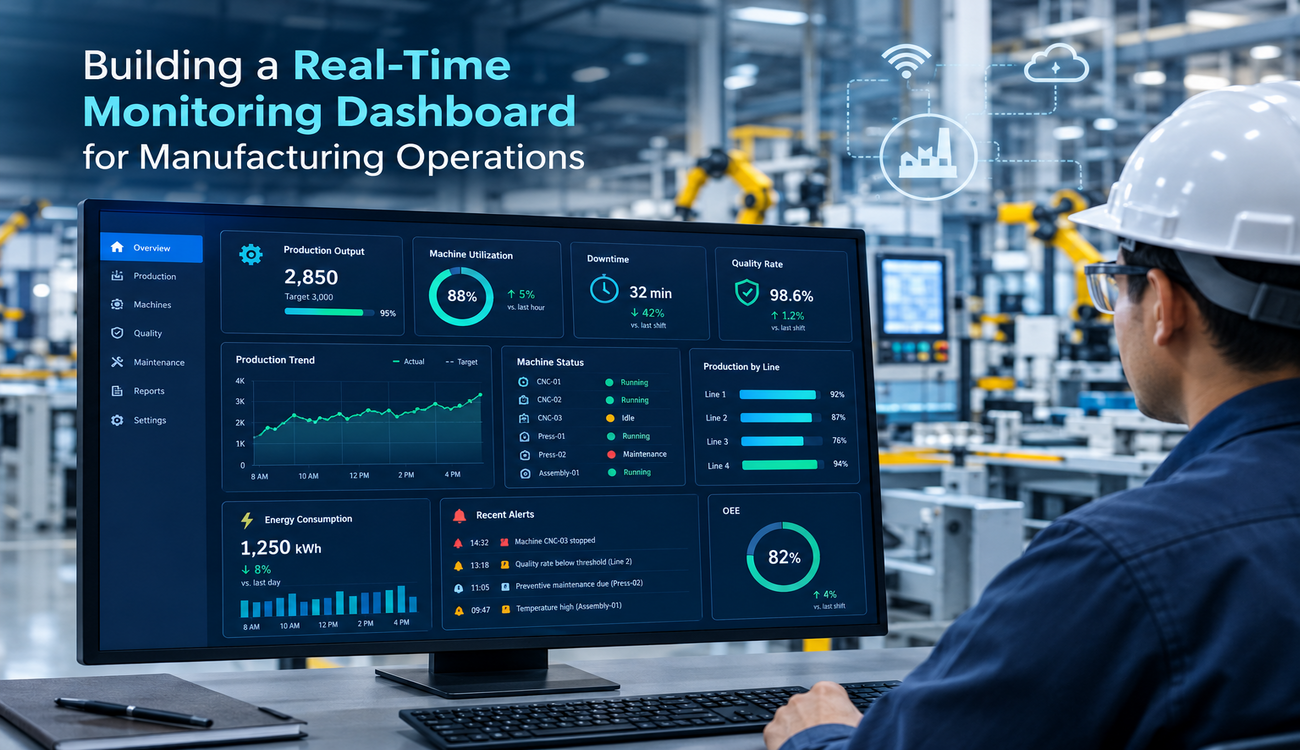
A Real-Time Monitoring Dashboard is a visual interface that collects and presents live or near-real-time manufacturing data in a centralized environment. It can display information such as machine status, production output, equipment performance, cycle times, downtime, quality indicators, energy consumption, and production targets.
Instead of waiting for end-of-shift reports, supervisors can view operational conditions as they change. Data from machines and connected systems can be processed and displayed through charts, graphs, status indicators, alerts, and performance metrics. This creates a clearer picture of current production conditions and helps teams recognize problems before they significantly affect operations.
Why Real-Time Visibility Matters in Manufacturing
Manufacturing processes are highly interconnected. A problem with one machine can affect downstream operations, production schedules, inventory availability, and delivery commitments. Delayed information can therefore increase the impact of operational disruptions.
Real-time visibility allows production teams to identify abnormal machine behavior, unexpected downtime, production delays, and quality variations earlier. Instead of discovering a problem after production reports are prepared, managers can investigate the situation while it is still occurring. This improves operational awareness and supports faster coordination between production, maintenance, quality, and management teams.
Key Components of a Manufacturing Monitoring Dashboard
Building an effective monitoring solution requires more than placing multiple charts on a screen. The dashboard should be designed around the operational questions that manufacturing teams need to answer every day.
Data Collection and Integration
The foundation of a monitoring dashboard is reliable data collection. Manufacturing facilities may use PLCs, SCADA systems, industrial sensors, IoT gateways, MES platforms, ERP software, databases, and other operational technologies. These systems often generate data in different formats and at different frequencies.
An integration layer can collect information from these sources and make it available to the dashboard. Depending on the manufacturing environment, technologies such as APIs, industrial communication protocols, IoT platforms, databases, and edge computing can be used to connect operational systems.
Key Performance Indicators
A dashboard should focus on metrics that directly support manufacturing decisions. Common indicators include overall equipment effectiveness, production output, machine utilization, downtime, cycle time, rejection rates, throughput, maintenance status, and order progress.
The exact KPIs should depend on the organization’s production model and operational objectives. Showing too many metrics can make the interface difficult to interpret. A focused dashboard should prioritize information that helps users understand performance and take action.
Alerts and Notifications
Monitoring becomes more useful when the system can identify conditions that require attention. Threshold-based alerts can notify users when machine temperatures, production downtime, quality rates, or other measurements move outside acceptable ranges.
More advanced systems can use historical data and analytics to identify unusual patterns rather than relying only on fixed thresholds. Alerts can then be directed to the appropriate teams so that issues can be investigated without unnecessary delays.
How to Build a Real-Time Monitoring Dashboard
A successful dashboard project should begin with business and operational requirements rather than technology selection. Manufacturers should first determine what problems the dashboard needs to solve and which users will depend on it.
Define Operational Objectives
The first step is identifying the purpose of the dashboard. A production manager may need visibility into output and downtime, while a maintenance team may focus on equipment condition and maintenance events. Quality teams may require information about defects, rejection rates, and process variations.
Defining these requirements helps prevent the dashboard from becoming an overloaded collection of unrelated metrics. Each visualization should have a clear operational purpose.
Identify Data Sources
After defining the objectives, manufacturers should map the systems that contain the required information. These may include production machines, PLCs, sensors, MES applications, ERP platforms, warehouse systems, quality management software, and maintenance applications.
Data quality should also be evaluated at this stage. Inconsistent timestamps, missing records, duplicate values, and disconnected systems can reduce the reliability of dashboard insights. Establishing a standardized data pipeline is therefore essential.
Design the Dashboard Architecture
The architecture determines how data moves from manufacturing equipment to the dashboard. In many environments, an edge layer can collect and process machine data close to the production floor before sending relevant information to centralized systems.
Cloud platforms can provide scalable storage and analytics, while on-premises infrastructure may be preferred for certain operational or security requirements. A hybrid architecture can combine both approaches, allowing manufacturers to process time-sensitive information locally while using centralized platforms for broader analytics.
Create a User-Centered Interface
A dashboard should be easy to understand during normal operations and under pressure. Important information should be visible without requiring users to navigate through multiple screens.
The interface can organize information by production line, plant, machine group, shift, or production order. Visual indicators can help users quickly distinguish between normal operating conditions and situations that require attention. Detailed information can then be available through drill-down views for users who need deeper analysis.
Using IoT and Analytics for Better Monitoring
The combination of industrial IoT and analytics can significantly expand the capabilities of a manufacturing dashboard. Connected sensors can continuously capture information such as temperature, vibration, pressure, energy consumption, machine speed, and operating status.
From Monitoring to Predictive Insights
Traditional dashboards primarily explain what is happening now. When historical data and analytics are incorporated, manufacturers can also investigate why certain patterns occur and anticipate potential problems.
For example, repeated increases in machine vibration may indicate changing equipment conditions. Combining this information with maintenance history and production data can help teams investigate potential issues before they develop into serious failures.
Analytics can also support production planning by identifying recurring bottlenecks, comparing machine performance, and evaluating production trends. This transforms the dashboard from a simple visualization tool into a broader operational intelligence platform.
Security and Scalability Considerations
Manufacturing dashboards often connect operational technology with enterprise IT environments, making security an important consideration. Access should be controlled according to user roles, while communication between connected systems should be protected.
Manufacturers should also consider how the dashboard will scale as additional machines, production lines, facilities, and data sources are introduced. A scalable architecture can accommodate new data sources without requiring the entire solution to be redesigned.
Data governance is equally important. Organizations should establish clear ownership of operational data, define retention requirements, and maintain consistent data standards across systems.
Benefits of Real-Time Manufacturing Visibility
A Real-Time Monitoring Dashboard can provide manufacturing organizations with greater operational transparency by bringing important information into one environment. Production teams can monitor performance continuously instead of relying exclusively on periodic reports.
Better visibility can support faster identification of downtime, production deviations, and equipment issues. It can also improve communication between departments because teams can work from a shared view of current operational conditions.
Over time, historical dashboard data can help organizations identify recurring production constraints and performance trends. These insights can support continuous improvement initiatives, maintenance planning, capacity management, and resource optimization.
Improving Decision-Making on the Production Floor
The value of a monitoring dashboard ultimately depends on how effectively teams use the information it provides. Managers should be able to quickly answer questions such as which production line is underperforming, where downtime is increasing, whether output is meeting the target, and which machines require attention.
When relevant information is available in context, teams can spend less time collecting and consolidating reports and more time addressing operational issues. This creates a more responsive approach to manufacturing management.
Common Challenges in Dashboard Implementation
Manufacturers may face several challenges when developing a monitoring solution. Legacy equipment may not provide modern connectivity options, while different machines may use different communication standards. Data may also exist in isolated systems that were never designed to exchange information.
Another challenge is dashboard complexity. Attempting to display every available metric can make the interface difficult to use. The solution is to prioritize metrics based on specific roles and operational requirements.
Change management should also be considered. Employees need to understand how the dashboard supports their responsibilities and how its information should influence operational decisions. Training and continuous feedback can help improve adoption.
Future of Real-Time Manufacturing Monitoring
Manufacturing monitoring is moving toward increasingly intelligent and automated systems. Artificial intelligence, machine learning, digital twins, edge computing, and advanced industrial IoT technologies are expanding what organizations can achieve with operational data.
Future Real-Time Monitoring Dashboard solutions are likely to combine live production information with predictive analytics, automated recommendations, and contextual intelligence. Instead of simply showing that a machine has stopped, intelligent systems may connect machine conditions, production schedules, maintenance history, and inventory information to help teams understand the broader operational impact.
Digital twins can further enhance this capability by creating virtual representations of manufacturing assets and processes. When connected with live operational data, they can provide deeper visibility into how changes in equipment or production conditions may affect overall performance.
Conclusion
Building a Real-Time Monitoring Dashboard for manufacturing operations requires a combination of reliable data integration, carefully selected KPIs, intuitive visualization, secure architecture, and a clear understanding of operational requirements. The goal should not be to display as much information as possible, but to provide the right information at the right time so teams can make informed decisions.
As manufacturing environments become more connected, real-time operational visibility will become increasingly important for improving productivity, reducing downtime, supporting predictive maintenance, and strengthening decision-making. Organizations that build their monitoring infrastructure around scalable data integration and actionable insights can create a stronger foundation for smarter and more responsive manufacturing operations.
FAQs
Q1. What is a Real-Time Monitoring Dashboard in manufacturing?
A Real-Time Monitoring Dashboard is a centralized digital interface that displays live or near-real-time manufacturing data. It can track machine status, production output, downtime, equipment performance, quality metrics, and other operational indicators, helping teams monitor production conditions and respond to issues more quickly.
Q2. What data can a manufacturing monitoring dashboard track?
A manufacturing monitoring dashboard can track production output, machine utilization, downtime, cycle times, equipment status, rejection rates, energy consumption, maintenance information, and production targets. The specific data depends on the machines, sensors, industrial systems, and business applications connected to the dashboard.
Q3. How does a Real-Time Monitoring Dashboard improve manufacturing operations?
A Real-Time Monitoring Dashboard provides continuous visibility into production activities, allowing teams to identify downtime, performance issues, and process deviations earlier. By bringing information from multiple systems into one interface, it can support faster decision-making, improve coordination, and help organizations identify opportunities for operational improvement.
Q4. Can a manufacturing dashboard integrate with IoT devices and existing systems?
Yes. A manufacturing dashboard can integrate with industrial IoT devices, sensors, PLCs, SCADA systems, MES platforms, ERP software, databases, and other business applications. APIs, gateways, industrial communication protocols, and integration platforms can be used to collect and standardize data from different sources.
Q5. What technologies are used to build a Real-Time Monitoring Dashboard?
A Real-Time Monitoring Dashboard can be built using IoT platforms, cloud or on-premises infrastructure, databases, APIs, data-processing systems, visualization frameworks, and analytics technologies. Edge computing can also be used to process time-sensitive machine data close to the production environment before sending information to centralized systems.
